I have been out of track for a while now. Julie is starting to get worried that I’m getting a little too present-oriented (YOLO lyf).
I think the problem starts when I stop checking in life metrics that directly correlates to my “sharpness”. Having no idea of how am I doing makes me care less of my performance. Resistance to know grows because I might not like what I find haha.
Somebody said that if you can’t track it, you can’t improve it.
What do I need to track?
I have 2 key performance indicator (KPI) that’s correlated with my work capacity and ability to plan about the future.
1. Screen Time – How much time I spend using a computer. This is tracked by running RescueTime that’s running in background of my computer all the time.
2. Intentional Work Time – How much time I spend intentionally working on something. “Intention” is the keyword. Regardless of how much I time I spend on a task, the important thing is if I am aiming at a clear end goal. Opposite of this is jumping from one distraction to the next without accomplishing anything concrete.
This is tracked by Toggl. The way it works is before I start using my computer, I have to put a short description of what I’m about to do and explicitly start Toggl’s timer.
Normally, I should have more or less 40 hours of screen time per week and around 20 hours of intentional work time. If I dip below 40 hours of screen time, it usually means I’m trying to avoid working by doing something else.
When I’m at my sharpest, I am more self-aware, this makes most of what I do to have clear intentions before I do them. The closer intentional work time to screen time, the better.
Out of sight, out of mind. The opposite is true too.
I need those 2 KPIs to be always in my sight. This will give me a general grasp of how I’m doing based on a concrete data. I can do my “getting back on track” checklist if I’m doing poorly.
I have the skillset to quickly whip up a simple dashboard that displays those data. I also have a spare tablet that I’m not using. I can use it to display my KPIs on 24/7 with very little power consumption (5V/1A).
Getting my hands dirty
1. Preps
I did not bother using any framework. It doesn’t matter how dirty the setup and the coding is since it’s personal use only. The goal is to display the correct data.
Originally I planned to use curl fetch the data but it looks like using API wrappers will be much faster and future-proof. I always went to the fastest solution because I want to have a working dashboard in one sitting.
I started 2 files: index.php for the gluing all the parts and composer.json for dependency management.
2. Getting RescueTime data
For RescueTime, I used borivojevic/rescuetime.
$rescuetime_key = "RESCUE_TIME_API_KEY";

use RescueTime\RequestQueryParameters as Params;
use RescueTime\Client;

$client = new Client($rescuetime_key);

$day = date('w');
$week_start = date('Y-m-d', strtotime('-'.$day.' days'));
$week_end = date('Y-m-d', strtotime('+'.(6-$day).' days'));

// Fetch activities for this week
$activities = $client->getActivities(
  new Params([
    'perspective' => 'interval',
    'resolution_time' => 'week',
    'restrict_begin' => new \DateTime($week_start),
    'restrict_end' => new \DateTime($week_end)
  ])
);
// Compute total time spent
$totalTimeSpent = 0;
foreach ($activities as $a) {
  $totalTimeSpent += $a->getTimeSpentSeconds();
}

$totalScreenTimeThisWeek = number_format(round($totalTimeSpent/60/60, 2), 2);
3. Getting Toggl data
For Toggl, I used ixudra/toggl.
$workspaceId = 0;
$apiToken = 'TOGGL_API_KEY';
$togglService = new \Ixudra\Toggl\TogglService( $workspaceId, $apiToken );

$response = $togglService->summaryThisWeek();

$totalIntentionalWorkThisWeek = number_format(round($response->total_grand/1000/60/60, 2), 2);
4. Displaying computed data to the page
<div>
    <p>Screen Time</p>
    <h1><?php echo $totalScreenTimeThisWeek; ?></h1>
</div>

<div>
    <p>Intentional Work</p>
    <h1><?php echo $totalIntentionalWorkThisWeek; ?></h1>
</div>
5. Keeping the data up-to-date
<!-- Refresh page every 10 minutes -->
<meta http-equiv="refresh" content="600" >
Putting everything together
I end up having a working dashboard in around 1.5h of intentional work. After the coding is done, I uploaded it to my server and load it in the tablet.
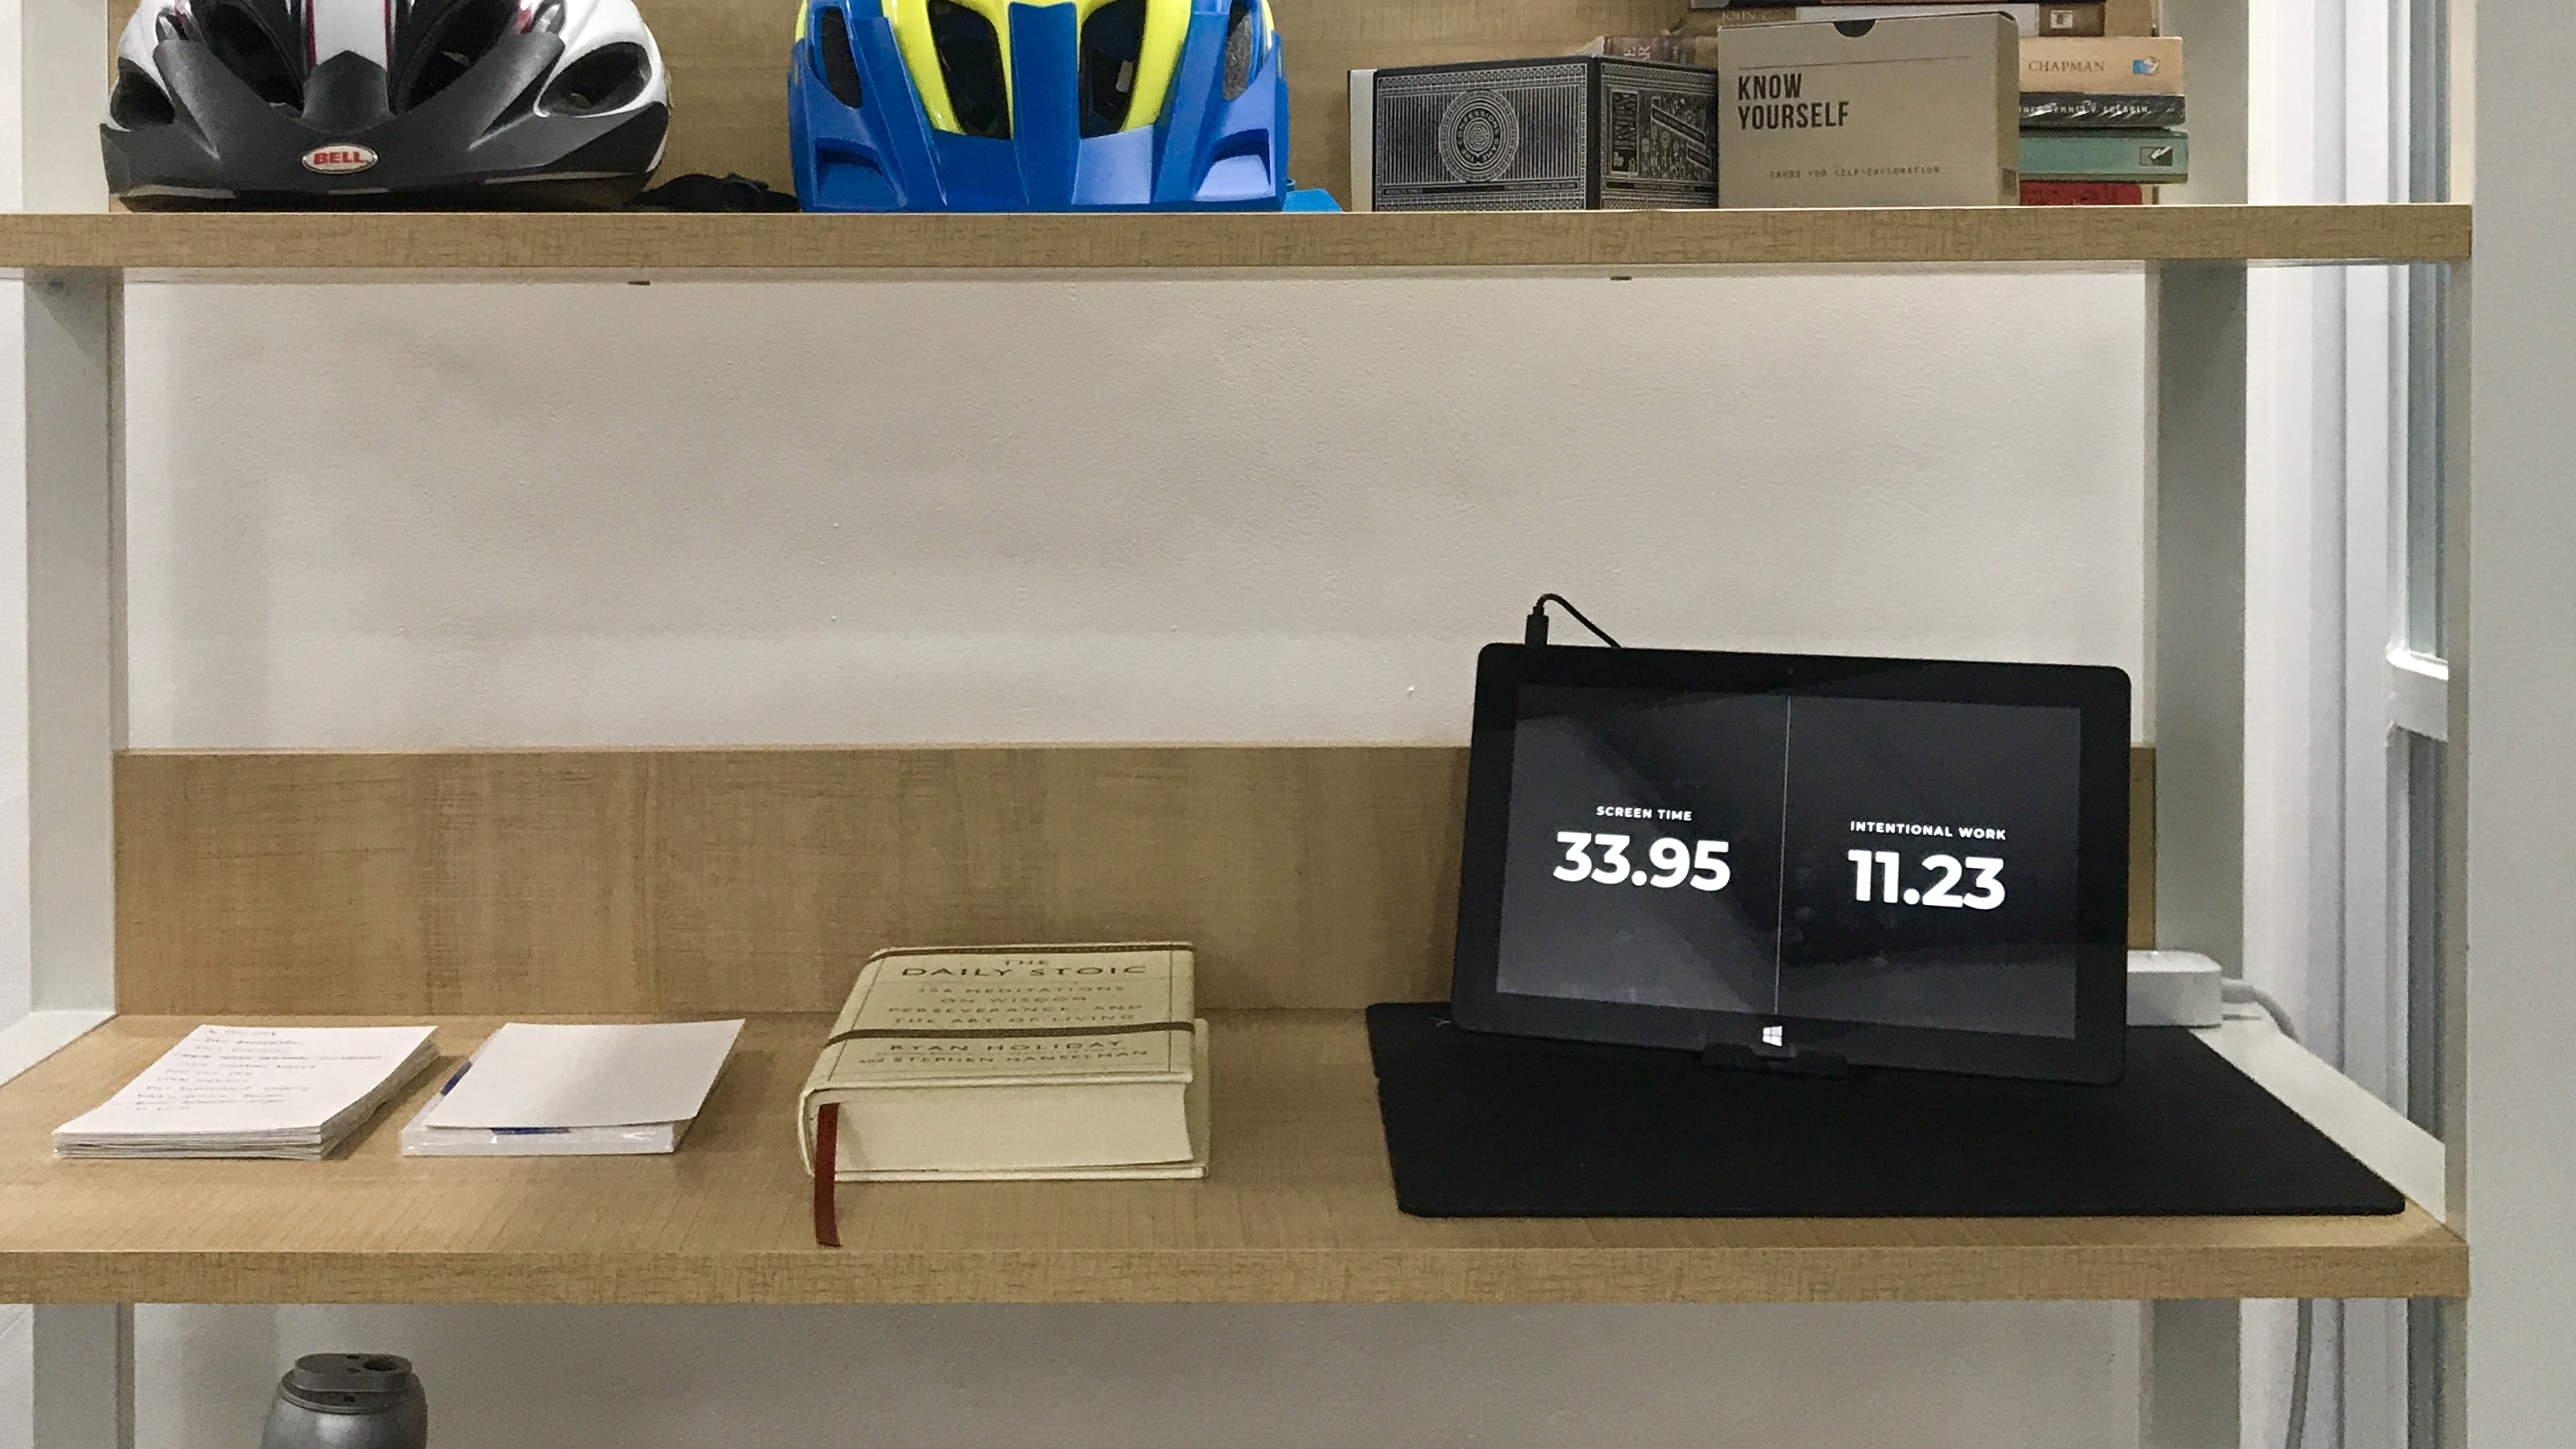
It sits on a shelve where I can see it everyday (together with The Daily Stoic, which I read 1 page everyday).
This sets a framework that I can update as needed if ever I need a new KPI to track. The process of adding a new data source will be just 1) figuring out how to get the data 2) displaying it. The boilerplate is done. The friction to update will be minimal.
If you are interested in this project, have a KPI to recommend, or just want to talk in general — feel free to reach out!